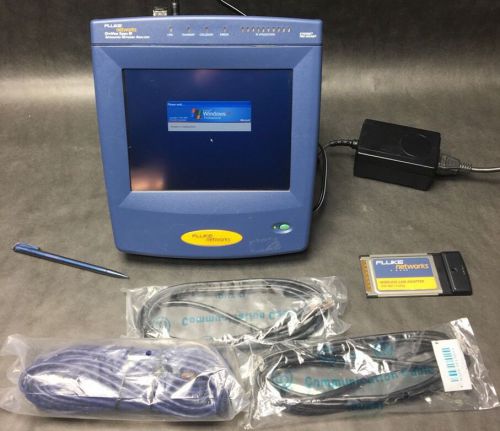
Fluke Optiview Series 3 III Gigabit OPVS3-GIG Network Analyzer Very nice cosmetics Pictures are exactly what if offered. Ships worldwide. Please request quote for non-US shipping. Trusted seller, fast shipping and always guaranteed!! Let us know if you need more than 1 unit Fluke Specs: 802.1X authentication Gigabit line rate capture, traffic Generation and Internetwork Throughput Free string match filtering and triggers with the ability to control capture and provide detailed event analysis VLAN trunk analysis Infrastructure device analysis using SNMPv3 Application Troubleshooting Expert option validates network services and provides detailed application flow analysis Management port for out of band remote control The powerful new Fluke Networks OptiView Series III Integrated Network Analyzer gives you a clear view of your entire enterprise – providing visibility into every piece of hardware, every application, and every connection on your network. No other portable tool offers this much vision and all-in-one capability to help you: Deploy new technologies and applications Manage and validate infrastructure changes Solve network and application performance issues Secure network from internal threats It shows you where your network stands today and helps you accurately assess its readiness for the changes you need to make. Traffic analysis at the touch of a button The OptiView Series III provides real-time statistics for traffic on the wire which enables the user to understand how network resources are being used and increase user satisfaction with faster response times for networked applications. Quickly and easily identify top talkers, multicasters and broadcasters or select top conversations to determine which hosts may be over utilizing resource bandwidth. Determine who is using server bandwidth by viewing top conversations to a single host. Analyze protocol mix to identify top protocols being used and also discover unwanted and custom protocols and see which protocols are being used by each host. Application analysis and troubleshooting Automatically discover all protocols and sub protocols from the MAC layer to the application layer. This enables IT staff to identify applications utilizing link bandwidth including those that use dynamically assigned port numbers to see and validate the impact of applications on bandwidth usage and also identify the use of illicit applications. Deep packet inspection differentiates between specific audio, video, image, and data applications, and shows the level of bandwidth usage of each. Perform application analysis in real-time on Gigabit links and determine the specific endpoints (server, host) using that application. A combination of layer 2 and layer 3 trace routes identifies the entire network path between the application client and the application server, speeding problem isolation. VLAN Visibility and Trunk Analysis Only “on the wire” analyzers can provide vision into actual VLAN trunk traffic. When connected to a switch trunk port, the analyzer will detect all VLANs available on that trunk, measure the traffic distribution across all the VLANs and provides the user with the capability of selecting a specific VLAN. If an individual VLAN is selected, device discovery, traffic statistics and packet capture data will only be displayed for that VLAN. Application-Centric Protocol Analysis Full-line rate capture ensures complete analysis Get Gigabit line rate packet capture and filtering to troubleshoot problems where packet level analysis is required and perform advanced troubleshooting when deploying and analyzing applications. Sophisticated capture filters allow collection of more relevant data and limit the amount of traffic to analyze by filtering on individual addresses or conversation, address range for IPV4, IPv4 subnet, IPv6 prefix and protocols. Application-centric analysis for simplified troubleshooting of application problems Once traffic is captured, launch the ClearSight Analyzer* (CSA) to see an application-centric view of the trace file. Through a simple and intuitive front page, CSA presents a comprehensive, high-level overview of the health of applications on your network. From that framework, you can drill down to gain access to more detailed information. For example, you can display all the activity for HTTP applications, then drill down to see activities on each server, and further down to the server flow to observe the actual media content of the flow. This unparalleled level of control and visibility speeds time to application problem resolution and minimizes overall network downtime. Automated problem/issue detection The CSA Expert Alert function automatically detects communication faults in captured packets and displays them with color coded icons. The specific application, server, or flow that has a problem can be seen at a glance from the Application Summary Front Page. Alerts detected by CSA are classified as issues (faults in the communication sequence) or problems (faults that exceed a threshold value) and can be listed separately. Lists can be sorted by simply clicking on a column header. You can drill down to the associated communication flow by right-clicking on an alert. Unique and powerful ladder chart illustrates application flow CSA ladder views (also known as application bounce chart) reveal conversations between client and server in the application command language without having to decode packets manually. It provides an extremely powerful way to understand protocol interactions between various network elements. Content Reconstruction and Playback You can recreate audio and video content from VoIP or video flows, either during real-time monitoring or from a tracefile. In addition, Microsoft® Exchange® email, Fax over IP, Instant Messages and HTTP-based web pages can also be reconstructed. This is very valuable as proof of compliance violation or visualization of multimedia quality. Advanced Network Discovery Finds devices, networks and problems in seconds. As soon as the analyzer is connected to the network, it automatically begins to discover devices on the network, with no interaction required, by monitoring traffic and actively querying hosts. IT staff can immediately see what is on the network and where it is connected, by switch, slot and port number. They can investigate and quickly locate “suspect” devices and with minimum effort identify problems associated with device mis-configurations.The analyzer categorizes devices by type: interconnect (routers, switches, and SNMP hubs), servers, printers, SNMP agents, VoIP devices, wireless devices, and other hosts. Additionally, networks are classified by IPv4 and IPv6 Subnets, VLANs, NetBIOS Domains and IPX Networks, and Wireless Networks together with host membership within each classification. Network devices that may be experiencing problems are also discovered. Examples of problems detected are: duplicate IP addresses, incorrect subnet masks, default router not responding and many more. VoIP and wireless device discovery The analyzer will discover VoIP devices including call managers and IP phones from Cisco, Nortel, Avaya and Mitel. Device capabilities and configurations may be viewed, allowing the user to easily identify and correct configuration issues during VoIP deployment. The analyzer also discovers and categorizes wireless LAN controllers, lightweight access points, intelligent access points and wireless clients. Detailed device information is provided from Cisco Wireless LAN controllers and LWAPs, including the wireless networks associated with the controller, the SSIDs, security and QoS parameters, the lightweight APs being controlled and the 802.11 protocol in use. Additional information is available for each wireless client including the name, IP and MAC address, the 802.11 protocol used, RSSI (Receive Signal Strength Indicator) and SNR (Signal to Noise Ratio) and the client status. Infrastructure Analysis Real-time infrastructure device analysis data speeds trouble-shooting. Get granular, real-time data into interface utilization and errors via SNMP – essential for troubleshooting persistent problems and deter-mining if excessive traffic and bandwidth utilization is the cause of performance problems. Interfaces can be quickly sorted by I/F index, utilization, broadcasts, errors, or collisions. LAN and WAN errors, alarms and utilization details are available in the trending view along with interface configuration information. Trace SwitchRoute™ Trace SwitchRoute allows you to see the exact path two devices use to communicate through your switch fabric. Trace SwitchRoute begins its discovery from the specified Source Device and traces the path to the specified Target Device. For each switch in the path, the displayed results include the DNS name and IP address, the inter-switch connections by port number, together with link speed and VLAN information. Highlighting any device in the Trace SwitchRoute name column and selecting Host Detail allows you to view that device’s network configuration information. Real-time multi-port interface statistics – including 10Gig Multi-port statistics. Discovery of switch VLAN configurations Router and WAN link analysis In-depth device analysis identifies Router ARP cache or routing table errors and also provides visibility to manage and troubleshoot costly WAN links. See WAN link configuration, a graphical display of utilization and error rates and identification of specific error types on ISDN, Frame Relay, T1/E1, T3 and ATM links.Telnet and web browser links to allow reconfiguration of devices directly from the analyzer. Traffic generation and throughput Assess network readiness for new deployments by determining the impact of the new application, or the addition of network users, by stressing your network with simulated traffic – up to full 1 Gbps. Protocol type, frame size, frame rate, percentage utilization and number of frames to transmit are user configurable, along with the type of traffic: Broadcast, Multicast or Unicast. Selectable protocols include: Benign Ethernet, Benign LLC 802.2, NetBEUI, Benign IP, IP ICMP Echo, IP UDP Echo, IP UDP Discard, IP UDP NFS and IP UDP NetBIOS. Selecting an IP protocol allows you to select Time to Live (TTL) parameters and TOS (QOS) parameters such as Minimum Delay, Maximum Throughput, Maximum Reliability, Minimum Monetary Cost and Maximum Security to ensure correct routing configurations. Port based network access control (802.1X) To speed deployment of IEEE 802.1X, the OptiView Series III is capable of performing a full 802.1x transaction with an authentication server to ensure correct credentials are being deployed. The analyzer supports 802.1X authentication through most common EAP (Extensible Authentication Protocol) types, 15 in total, allows import of software certificates and can store multiple authentication profiles to allow connectivity to different broadcast domains or networks with multiple authentication servers for deployment, validation and troubleshooting. A connection log for detailed 802.1X protocol exchange analysis is also generated. Remote user interface Simply point a web browser at the IP address of a correctly configured OptiView Series III Portable Network Analyzer to retrieve saved reports and capture files. You can also install a Remote User Interface (UI) and use your PC to obtain remote access to an analyzer over a TCP/ IP connection. Once the Remote UI is installed, simply give the interface the IP address of the analyzer to monitor and see an almost identical interface to the analyzer’s local interface. Communications between the analyzer and Remote UI can also be encrypted. A single portable analyzer will support seven remote sessions for collaborative troubleshooting or opening of multiple sessions on a PC to provide a remote dashboard view. Additionally, use the analyzers management port to configure and monitor for out of band management independently of the network under test port. User accounts Through the user accounts screen, you can add and modify analyzer security information for each individual analyzer user, which prevents unauthorized use of certain analyzer features for easier compliance with regulatory requirements. Features that can be disabled include packet capture and decode, traffic generation, remote user interface and analyzer configuration. Context sensitive help Help is contextually linked to each screen in the analyzer. While that help screen is displayed, you may select other information from the table of contents, choose an index entry, or perform a full text search on any help topic or term. Portable Network Analyzer removable hard drive option for classified environments. See what’s happening on your classified network by simply connecting one single tool that ensures any sensitive data stored on your network analyzer’s hard drive never leaves that environment. Fluke Networks OptiView Series III Portable Network Analyzer with removable hard disk drive is a new approach to classified environment network analysis that provides you with the Network SuperVision you need for all seven layers, along with the speed and simplicity your organization demands. Network information discovered by the OptiView Series III Portable Network Analyzer can be stored on the removable hard drive which allows the analyzer to be moved from classified environments of different levels and between classified and unclassified systems by simply replacing the hard drive. Reporting/documenting made easy While viewing the statistics, discovery or detail screens, pressing the Reports key will generate HTML reports on Protocols, Top Hosts, Top Conversations, Devices, Networks, Problems and many more. These reports are saved and may be viewed locally or remotely using a web browser. For advanced documentation, add OptiView Reporter and automatically import the OptiView Analyzer data for reporting, trending and event notification. OptiView Reporter’s integration with Microsoft Office Visio diagramming program allows you to create network maps showing the links between your servers, switches, routers and hosts. End-to-end application testing and monitoring with NetAlly. Technical Specifications Specifications are provided by the manufacturer. Refer to the manufacturer for an explanation of the print speed and other ratings. Battery Technology: Lithium ion Voltage Provided: 11.1 V Environmental Parameters Max Altitude Operating: 4600 m Max Operating Temperature: 40 °C Max Storage Temperature: 71 °C Min Operating Temperature: 10 °C Min Storage Temperature: -40 °C Header Brand: Fluke Manufacturer: Fluke Networks Model: Gigabit (OPVS3-GIG w/1000BASE-SX) Packaged Quantity: 1 Product Line: Fluke OptiView Series III Integrated Network Analyzer Dimensions & Weight Depth: 6.4 cm Height: 26 cm Weight: 2.2 kg Width: 23.4 cm Display Color Support: Color Display Resolution: 800 x 600 Features: Touch-screen Technology: LCD Fiber Fiber Type: Multi-mode Wavelength: 850 nm Network Tester Cable Types: CAT3 , CAT4 , CAT5 , CAT5e , CAT6 , FTP , UTP Compliant Standards: CSA , UL Connectors: RJ-45 , SFP Device Type: Analyzer Features: USB connectivity Included Accessories: AC power adapter Media: Copper , Fiber Tests, Tools and Measurements: Ethernet traffic generation , Traceroute , Traffic analysis Power Input Voltage: 100-240 V Output Voltage: 15 V
By clicking "Accept All Cookies", you agree to the storing of cookies on your device to enhance site navigation, analyze site usage, and assist in our marketing efforts.