US $1800
Directions
Similar products from Spectrum Analysis Systems
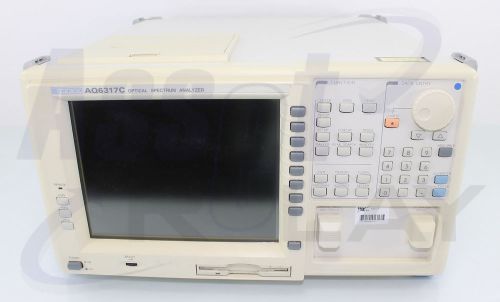
Ando AQ6317C Optical Spectrum Analyzer ( OSA ) with Calibration Certificate
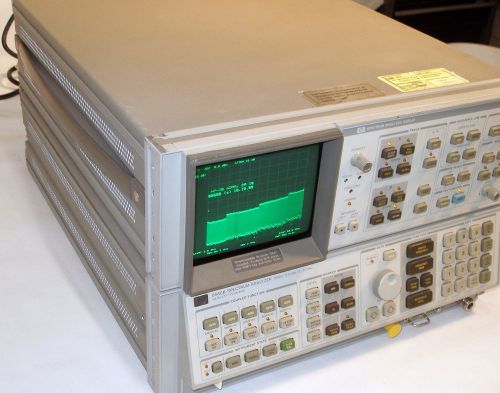
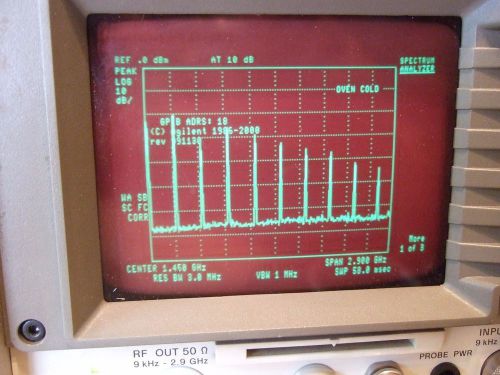
HP Agilent 8566B 100Hz - 2.5GHz / 2-22Ghz Spectrum Analyzer w/ Display & Cables
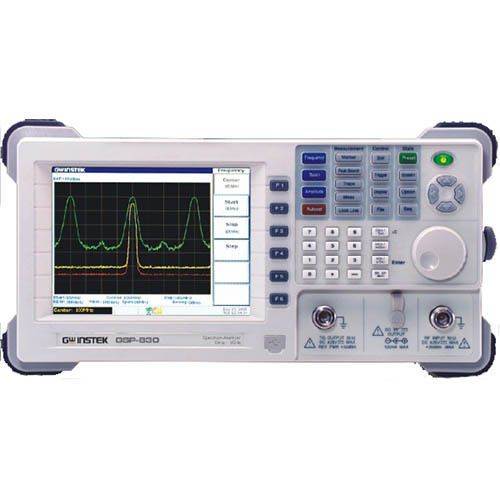
Instek GSP-830 9 KHz - 3 GHz Spectrum Analyzer
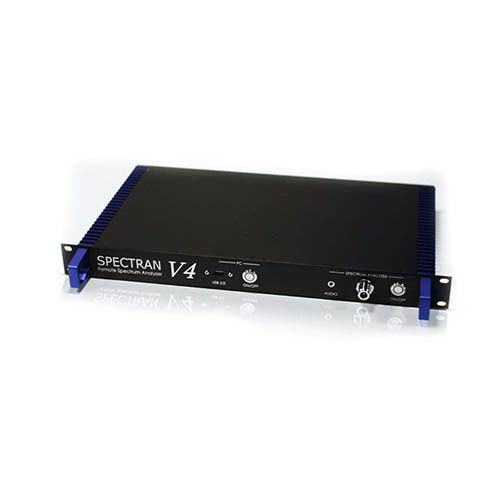
Kaltman RSA9000 Rack Mounted 1MHz - 9.4GHz
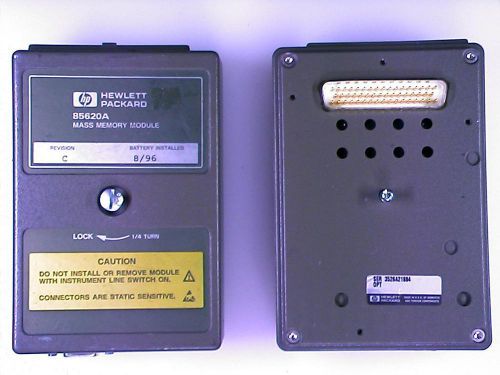
HP 85620A Spectrum Analyzer Mass Memory Module in good condition.

Motorola R2600B/NT Communications System Analyzer | Cursor Movement Keys
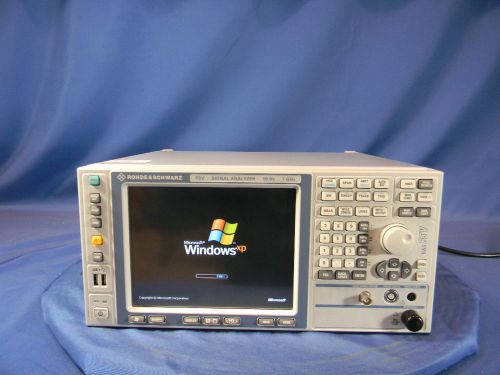
Rohde & Schwarz FSV7 7GHz Spectrum Analyzer 30 Day Warranty
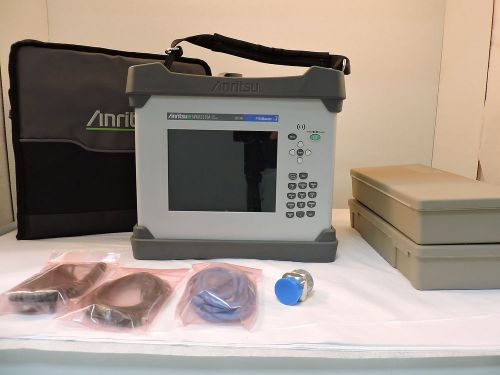
Anritsu MW82119A PIM Master Passive Intermodulation Analyzer, 700MHz
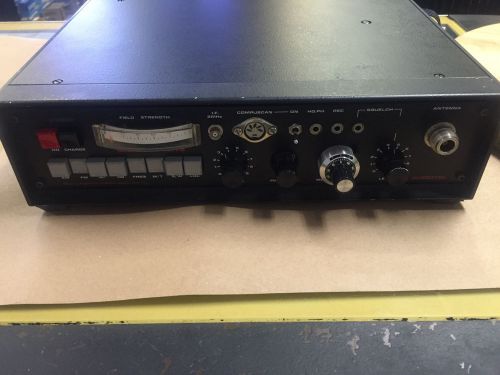
Scanlock Mark VB Automatic TSCM bug finder Compuscan ready version
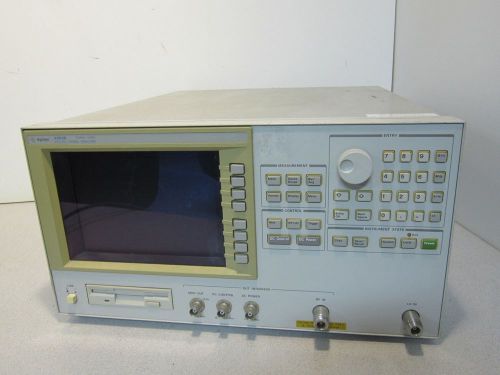
Agilent 4352B VCO/PLL Signal Analyzer 10MHz-3GHz
HP 8594E 2.9 GHz Spectrum Analyzer working fine!
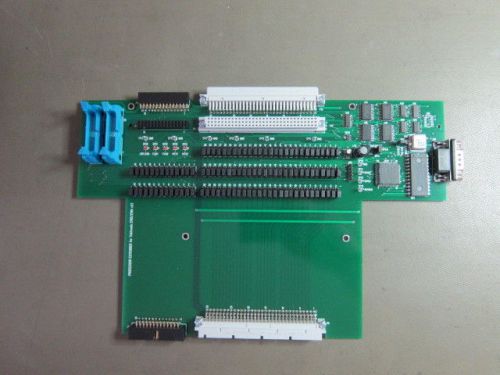
Processor Extender Board for TEK Tektronix 2782, 2784
Agilent E4408B Spectrum Analyzer 9kHz - 26.5GHz ESA-L (Works GREAT)
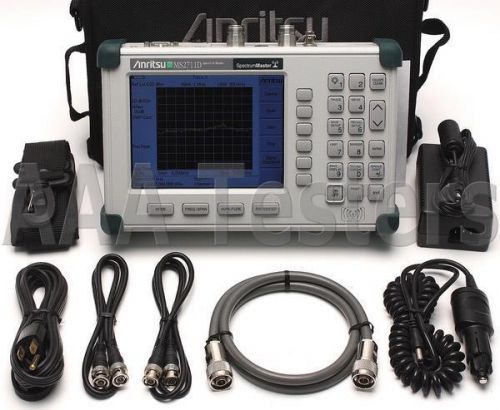
Anritsu MS2711D HandHeld Spectrum Master Analyzer w/ Options 3 & 21 MS2711
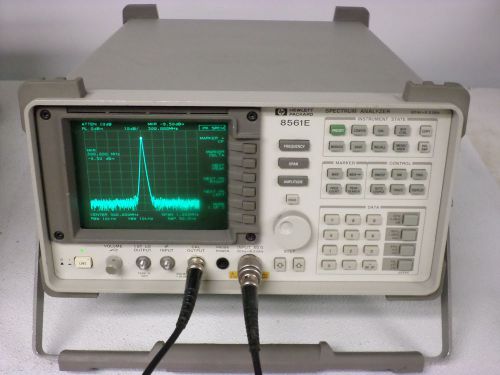
HP 8561E Spectrum Analyzer 30Hz-6.5GHz w/Option 7 & HP 85620A Mass Memory Module
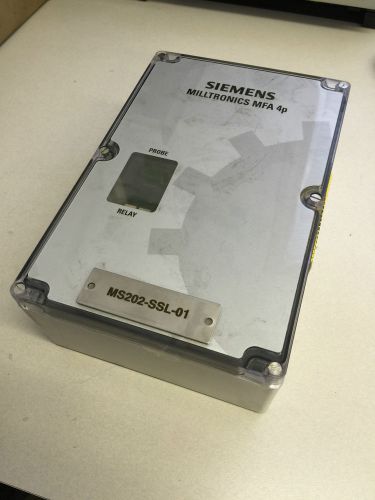
SIEMENS MILLTRONICS MFA 4p - 7MH71441AA2 - Motion Failure Alarm Controller
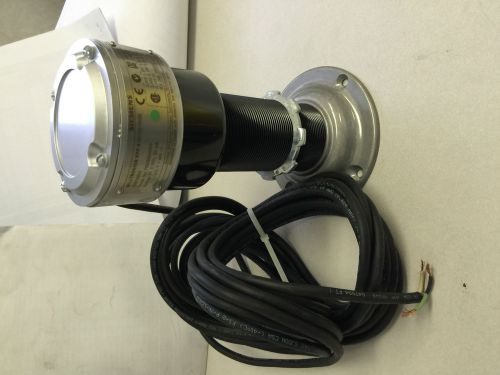
SIEMENS Motion Sensing Probe CE, XXP-5, Explosion Proof, 10M, CE - 7MH71460HA
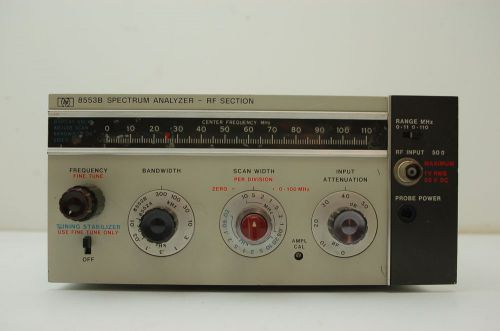
Hewlett Packard Spectrum Analyzer RF Section 8553B
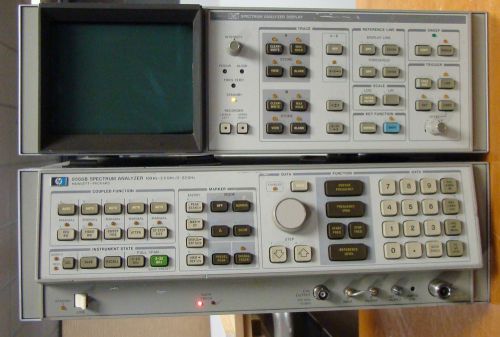
HP 8566B Spectrum Analyzer & Display 85662A Hewlett Packard
People who viewed this item also vieved
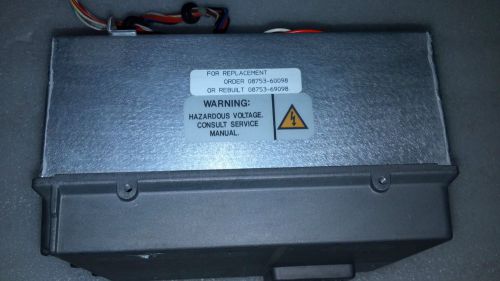
HP 08753-60114 PSU / 08753-60098 / 08753-69098 for HP-8510C Network Analyzer
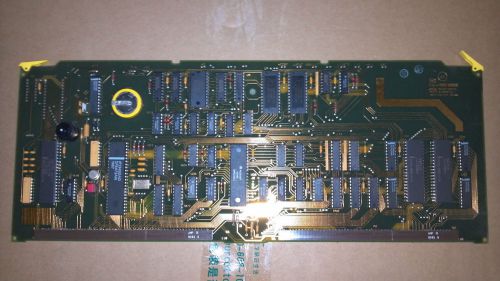
85101-60272 / A-3228-45 Imput / Output Board for HP-8510C Network Analyzer
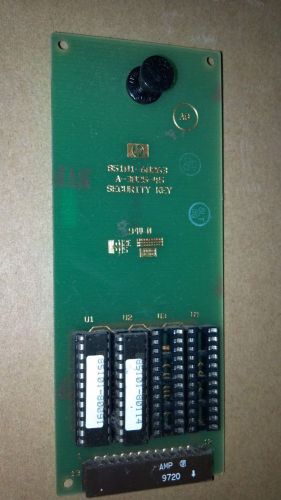
85101-60263 / A-3025-45 Security Key PCB for HP-8510C Network Analyzer
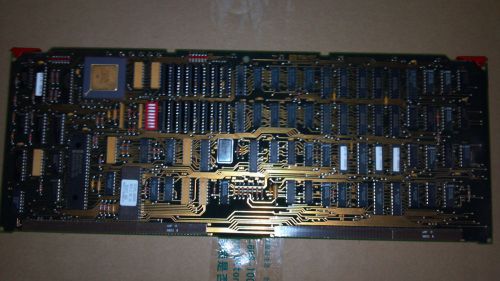
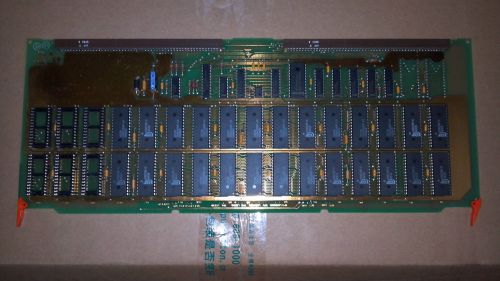
85101-60245 / C-3051-45 PCB for HP-8510C Network Analyzer
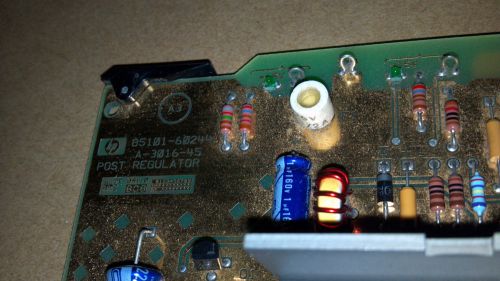
85101-60244 / A-3016-45 Post Regulator PCB for HP-8510C Network Analyzer
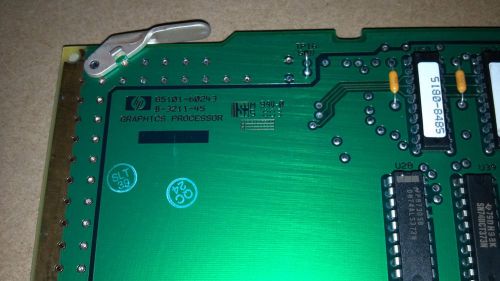
85101-60243 / B-3211-45 PCB for HP-8510C Network Analyzer
85101-60238 / A-3019-45 PCB for HP-8510C Network Analyzer
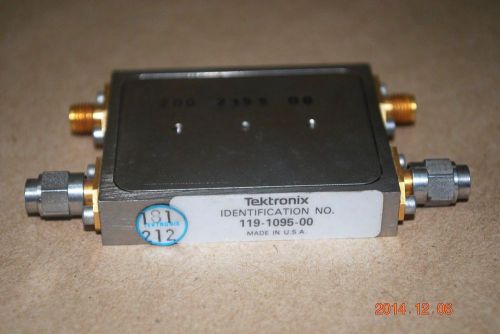
TEK 492/492P Spectrum Analyzers Diplexer (A14) I.D. No. 119-1095-00
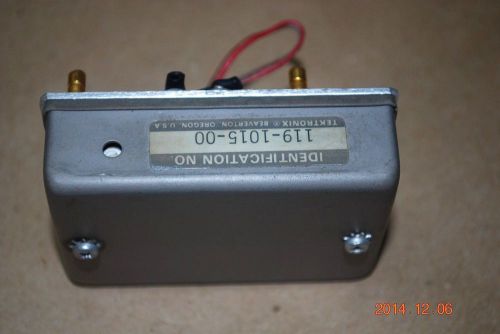
TEK 492/492P Spectrum Analyzers 110 Mhz IF AMPLIFIER (A13) I.D. # 119-1015-00

Tektronix 492 494 496 495 Spectrum Analyzer Display Face Plate Cover
By clicking "Accept All Cookies", you agree to the storing of cookies on your device to enhance site navigation, analyze site usage, and assist in our marketing efforts.
Accept All Cookies