Fluke Optiview T1 E1 Wan Analyzer Opv-wan/t1/e1 Opv-wan

US $795.00

  • Toledo, Ohio, United States
  • Jan 29th
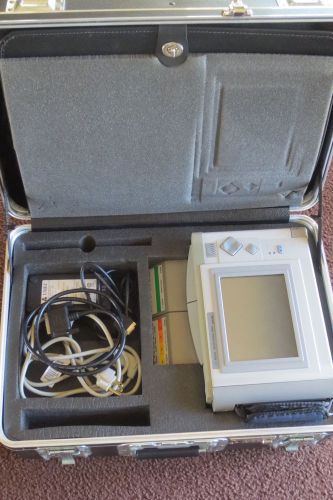
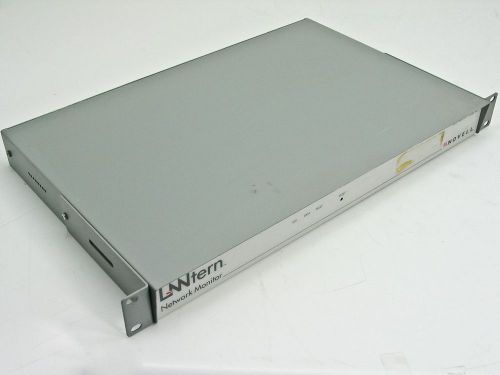
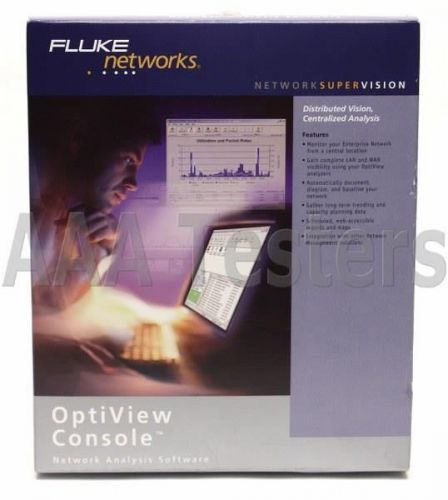
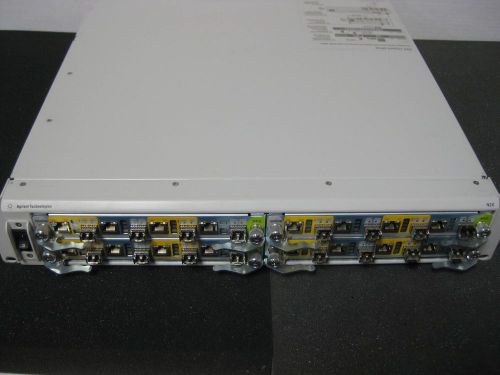
                                                              Content on this page requires a newer version of Adobe Flash Player.                      The Following Items Are Included: Fluke Networks OptiView T1/E1 WAN Analyzer OPV-WAN/T1/E1 Cat5e Patch Cord Power Cord RS232 PC Interface Cable User Manual On CD-ROM     BE SURE TO CHECK OUR EBAY STORE FOR OTHER ITEMS!   Fluke Networks OptiView T1/E1 WAN Analyzer OPV-WAN/T1/E1   Supports fractional or full T1/E1 interfaces in real-time   Supports Frame Relay, PPP and HDLC technologies   This Unit Works In Collaboration With Fluke Networks Optiview Network Analyzers. Click Here To See Our Selection Of Fluke Networks Optiview Network Analyzers.       Working Condition: Excellent Condition: Used Warranty: 90 Day Exchange Warranty     At a Glance Simple, fast deployment Supports fractional or full T1/E1 interfaces in real-time Supports Frame Relay, PPP and HDLC technologies Built-in T1/E1 Tap or serial interface   Description OptiView WAN Analyzers give you an immediate, comprehensive view of your T1 to OC12 WAN links for proactive management and high performance troubleshooting. Fast Vision into your WAN Links. The OptiView T1/E1 WAN Analyzer provides a complete view of your WAN link performance and facilitates rapid problem resolution from the convenience of your desktop. From any workstation, remotely access the health status of any of your WAN links from the physical layer to the application layer and even perform remote protocol analysis when necessary. Auto detection of any new application or port seen on your link keeps you informed on the traffic traveling over your valuable WAN connections. Use the OptiView T1/E1 WAN Analyzer as an independent system or as part of an integrated management solution.      Configurations The OptiView WAN T1/E1 Analyzer supports Frame Relay, Point-to-Point and HDLC over T1 or E1, all on one platform. It is incredibly compact, being only a half rack width and single height (1U). The Analyzer's design provides the ability to monitor different types of links and future proof against migration to different link layer technology. The OptiView WAN T1/E1Analyzer is equipped with two traffic interfaces that can simultaneously monitor both the DTE and DCE traffic data streams of a T1 or E1 link. Full duplex traffic patterns are displayed simultaneously for all link analysis. Each OptiView WAN T1/E1Analyzer has a dedicated 10/100 Mbps Ethernet RJ-45 management port that allows it to be controlled remotely from any point on the network using the Optiview Analyzer Remote Software (included with the analyzer). Up to 8 users may access any single WAN Analyzer and perform different analysis concurrently. Settings of the OptiView WAN Analyzer system, such as SNMP Trap destinations, scope of discovery and user authentication and access level privileges, are easily configured from any workstation running the analyzer's Remote Software. The user security settings provide the necessary flexibility to comply with new requirements imposed by Sarbanes-Oxley for data viewing and access. The Analyzer is literally as easy to install as a household appliance. Connect the WAN link through the Analyzer as a pass-through box (there is a built in tap), plug in the power supply and Ethernet management port, install the user interface software on a PC and launch the application. Network visibility is gained instantly as the analysis engines automatically provide instantaneous discovery and analysis into your WAN ? no configuration required.      Network View The OptiView WAN analyzer can be used to identify WAN issues such as virus attacks, new unknown applications, unauthorized access attempts, and irregular traffic patterns. Once identified, undesirable traffic can be eliminated for improved WAN performance, possibly eliminating the need for link upgrades and delivering instant ROI. Business applications which drive competitiveness require special attention over WAN links since they often introduce the most problems for remote users. OptiView WAN analyzers deliver the necessary flexibility to categorize applications and track their usage by user and over time. This helps to ensure centralized applications can perform over the WAN for remote user productivity. The information-rich OptiView WAN Analyzer Front Page gives you instant vision into what's happening on your WAN link with easy-to-use drill-down capability. For any given WAN link, the analyzer displays the most critical elements of the circuit in a simple "at a glance" screen. Verify near-end and far-end router endpoints, T1/E1 physical layer connectivity, LMI heartbeat and number of VCs in one easy view. In the same view, statistics such as link utilization, top hosts, conversations and applications allow you to see how valuable bandwidth is being consumed. A device inventory automatically classifies discovered network elements by type. Problems and alerts seen by the analyzer are displayed in a separate pane alerting you to any issues that might require further investigation. Each analysis area provides instant drill-down with a single click of the mouse.      Circuit Properties Verify Virtual Circuit Configurations Understanding your WAN configuration and status can eliminate finger pointing between the service provider and your business when issues arise. The OptiView WAN Analyzer continuously monitors the physical and link layers of T1 or E1 WAN circuits, immediately identifying any problems with the physical link. All VCs are automatically discovered along with DLCIs and associated router end points. Properties of each DLCI can be added to include a description, capacity, CIR and committed burst size. Layer 1 and Layer 2 auto detection The OptiView WAN analyzer automatically determines Link Speed (T1 or E1), framing format, line coding, DLCIs, encapsulation, LMI type and interface type. Users may configure unique circuit parameters including DS0 speed, fractional T1 assignments, maximum frame size, N392 error threshold, N393 monitored events count and T392 verification timer. LMI Properties LMI statistics are automatically generated for the link monitored including LMI errors, LMI details and VC availability. LMI errors include channel inactive seconds, reliability errors and protocol errors for both DTE and DCE. LMI details include state, channel inactive events, last channel inactive event timestamp, LMI type and interface type. VC availability statistics include VC name, status, last status change timestamp, outage count, percentage available, Mean Time Between Service Outage and Mean Time To Service Restore. All WAN physical layer statistics can be printed into an HTML report for delivery to your service provider if necessary.      Errors and Alarms T1/E1 Errors and Alarms The OptiView WAN Analyzer detects the most common errors and alarms that occur on T1/E1 links. Alarms detected include loss of signal, loss of frame, out of frame, AIS / RDI and far end SEF/AIS. These alarms are monitored separately for DTE and DCE sides and include current and historical alarm occurrences as well as number of seconds the link was in a given alarm state. Error packet counts for frame bit errors, line coding violations and path code violations are also presented for both DTE and DCE sides. Finally, performance statistics per ANSI T1.231 such as line errored seconds, errored seconds, bursty errored seconds, severely errored seconds, severely errored frame seconds, unavailable seconds and degraded minutes are also displayed. All error reports can be printed or forwarded in and easy to read HTML format. Problem Log Any errors that exceed user configurable threshold parameters are also displayed in the Problems log screen.      Device Analysis Devices are discovered by monitoring WAN traffic for source and destination IP devices. For all discovered devices, the OptiView WAN Analyzer will present the discovered host by IP address and best name (DNS, NetBIOS or SNMP). The OptiView WAN Analyzer differentiates between various types of host devices such as Routers, Servers, SNMP agents and user workstations. If desired, the Device list may also be configured to include ?off-net? devices. All devices may be sorted in ascending or descending order by Virtual Circuit, IP address or name. By highlighting a specific host and selecting the Host Detail button, you can obtain valuable information on that host such as which VCs it is using, which services are running (if a server), which routing protocols are running (if a router).      Statistics Utilization OptiView WAN analyzers offer a full battery of utilization statistics. Examine utilization for the entire circuit across all VCs or drill into any individual virtual circuit for specific utilization data by user group. Utilization statistics are updated every 5 seconds and up to one week's worth of data is stored on the Analyzer. Verify bandwidth usage is within design parameters. This capability lets you ensure service providers are delivering accurate throughput that is error-free and appropriately prioritized. Application Analysis OptiView WAN analyzer recognized today's most common applications and lets the users configure the identification of any custom applications unique to an organization. Examine application distribution for the entire circuit or for any selected virtual circuit. Protocol hierarchy is displayed in a familiar "file" format and categorized by OSI layer from the network layer through the application layer. Easily display protocol distribution up and down the OSI stack by clicking on the appropriate file and the protocol breakdown is immediately displayed on the right side of the screen. Both graphical and tabular views are available. When a non-well known protocol is detected, it is automatically added to the monitor list and displayed with the port number denoted. Top Virtual Circuits The OptiView WAN Analyzer's unique design examines packets across all virtual circuits simultaneously. This allows users to sort virtual circuits in rank order by a variety of metrics including total octets, throughput, percent of total VC capacity, average percent of CIR and other metrics. This feature allows the user to quickly pinpoint problem VCs with a single, comprehensive sweep of all traffic across all VCs simultaneously. Top Hosts, Conversations and Applications Top hosts utilizing the WAN link are determined by the OptiView WAN Analyzer. Examine top hosts for the entire circuit or for any selected virtual circuit. Filter the top hosts you want to see by protocol using a familiar "file" format interface. Easily display top hosts up and down the OSI stack by clicking on the appropriate file and the top hosts are immediately displayed on the right side of the screen. Both graphical and tabular views are available. Top conversations are also displayed using a similar format. So for example, you could view the HTTP conversations pairs consuming the most bandwidth on a particular VC. A top applications view may also be displayed. This display aggregates all IP applications from both TCP and UDP traffic before sorting the applications in rank order.      Packet Capture For in depth problem solving, the OptiView WAN Analyzer integrates a full packet capture function. The WAN Analyzer is capable of full line-rate packet capture and can capture up to 256 megabytes of data. Just select the Capture tab and immediately start capturing packets on your WAN link. For more refined packet captures, use the context sensitive filters. Simply select the host device from the device discovery screen, or a conversation from the statistics screen, click on the filter button and the packet capture engine is automatically populated with source and/or source and destination addresses of your selection. If you need even more selectivity, you can select a host or conversation using a particular protocol just as easily. Simultaneously capture packets on multiple virtual circuits. Probe all packets across all VCs in real-time to dramatically improve troubleshooting and monitoring efficiency. And just as you would expect from a traditional protocol analyzer, the OptiView WAN Analyzer packet capture screen allows you to set a number of pre-capture filters including captures only on a specific DLCI, only FECN or BECN traffic, only DE frames, only traffic from a specific protocol and/or specific UDP and TCP port numbers, and many other filters. Set capture triggers to denote when to start your capture based on all these parameters as well. Once you have the configuration you need, select Start Capture and let the analyzer filter and capture while you make another selection from the variety of tests to get a different view of your network. The analyzer continues to capture packets while you look at something else. When you stop the capture, select Save File to automatically save the capture file to your controlling PC's hard drive. If you have the Fluke Networks OptiView Protocol Expert (PE) installed on your PC, you can select View File to launch the application and view the decodes instantaneously.   Specifications PC system requirements for user interface   Operating system  Windows 2000, XP or Windows 2003  Hard disk space  65 MB (temporary)  Processor speed  200 MHz Pentium  System RAM  128 MB  Display  800 x 600 video SVGA  Disk drive  120 MB free hard disk space CD-ROM drive  General Specifications   WAN technologies  Frame Relay, HDLC & PPP  Media access  Built-in or external Passive T1/E1 tap (RJ48). RSV Serial V.35, X.21, RS-449, EIA-530, RS-232 (via Y-cable to RSV port)  Configuration port  Serial RS-232 (9-pin male)  Management port  10BASE-T/100BASE-TX (RJ-45) Ethernet, Full and Half Duplex  Capture memory  256 Mbytes  Interface  Java-based Remote GUI  Power  100 to 240 VAC; 47/63 Hz; 25 watts  Dimensions  1.6 x 8.3 x 12.9 in (4.1 x 21.1 x 32.8 cm)  Weight  3.8 lbs. (1.7 kg)  LED indicators (4)  Signal (DTE&DCE), Mgmt port Link, Pwr  Vibration  Meets requirements of MIL-PRF-28800F for Class 3 equipment  Operating temperature  10° C to 30° C (50° F to 86° F) with up to 95% relative humidity; 10° C to 40° C (50° F to 104° F) with up to 75% rela-tive humidity  Non-operating temperature  -20° C to +60° C (-4° F to +140° F)  Connection to public telephone network: Do not connect the analyzer’s network interfaces to public telephone systems.   Standards compliance   DS1:ANSI T1.102, T1.107, T1.231, T1.403, AT&T Technical References 54016 and 62411.   E1: ITU-T G.703, G.704, G.706, G.775, G.821, and G.826.   RFC compliance   2819 RMON MIB, 2021 RMON2 MIB, 2895 RMON Protocol Identifier Reference, SMIv2 [2011 IP, 2012 TCP, 2013 UDP], 2233 IF-MIB, RFC 2495 DS1/E1 MIB, RFC 2496 DS3/E3 MIB, 2954 Frame Relay Service MIB, 2115 Frame Relay DTE MIB.   Safety and EMC information   Complies with CSA C22.2 No. 1010, UL 61010B and EN60950 3rd edition (CE Mark).   EMC: CE Complies with EN61326 Class A, criteria C.     Please check our Huge Inventory with savings of up to 80% off of retail on Cat5/5e/6 LAN Cable Certifiers and Fiber Optic OTDR's, Fusion Splicers, CATV Meters, Fiber Optic Kits, Sources, Meters, Tools, Network Analyzers and much more. Here is a Link to our Ebay Test Equipment Store. All of our Test Equipment is backed with a Full Warranty and unbeatable customer support & service. Please don't hesitate to contact us for a Quote on Something you don't see in our inventory, sometimes we have items that may have not been listed or processed yet.   Test Equipment Store Offers a wide range of Refurbished Telecom/ Datacom Tools and Test Measurement Equipment. Which includes Fiber Optic Test and Splicing tools, Fusion Splicers, OTDRs, Copper and Fiber Cable Certifiers, CATV Test Equipment, Cable and Antenna Analyzers, Network Analyzers and much more!   We carry a large inventory of quality refurbished and used test equipment from all the major manufacturers. If you are looking for multiple quantities or if we don't have a listing for a particular item that you are looking for. Please contact us as it may be fresh inventory waiting to be listed or we'll be glad to find it for you at the best price possible and put up an eBay listing for you!   Contact: Test Equipment Store eBay Sales Phone: 1-419-517-6681 Toll Free : 1-800-548-2381     We Ship World Wide!   We will attempt to ship your item(s) within 24 hours after payment has been received. To get a real-time shipping quote to your destination, enter your country and zip / postal code information into the shipping calculator and click "Get Rate". Many countries impose their own customs, duties, tariffs, taxes, etc. on items being shipped from a foreign country. We do not cover those cost's and we recommend that you contact your countries customs agency for that information. We Offer Multiple Quantity Price & Shipping Discounts, Email Us If You Are Interested In Larger Quantities.   Shipping Rate Calculator Enter your ZIP/POSTAL code: Select your COUNTRY: United States Canada United Kingdom Afghanistan Albania Algeria American Samoa Andorra Angola Anguilla Antigua and Barbuda Argentina Armenia Aruba Australia Austria Azerbaijan Republic Bahamas Bahrain Bangladesh Barbados Belarus Belgium Belize Benin Bermuda Bhutan Bolivia Bosnia and Herzegovina Botswana Brazil British Virgin Islands Brunei Darussalam Bulgaria Burkina Faso Burma (Myanmar) Burundi Cambodia Cameroon Cape Verde Cayman Islands Central African Republic Chad Chile China Christmas Island Cocos (Keeling) Islands Colombia Comoros Congo, Democratic Republic of the Congo, Republic of the Cook Islands Costa Rica Cote d Ivoire (Ivory Coast) Croatia, Democratic Republic of the Cuba Cyprus Czech Republic Denmark Djibouti Dominica Dominican Republic Ecuador Egypt El Salvador Equatorial Guinea Eritrea Estonia Ethiopia Falkland Islands (Islas Makvinas) Fiji Finland France French Guiana French Polynesia Gabon Republic Gambia Georgia Germany Ghana Gibraltar Greece Greenland Grenada Guadeloupe Guam Guatemala Guernsey Guinea Guinea-Bissau Guyana Haiti Honduras Hong Kong Hungary Iceland India Indonesia Iran Iraq Ireland Israel Italy Jamaica Japan Jersey Jordan Kazakhstan Kenya Kiribati Kuwait Kyrgyzstan Laos Latvia Lebanon Lesotho Liberia Libya Liechtenstein Lithuania Local State/Province Luxembourg Macau Macedonia Madagascar Malawi Malaysia Maldives Mali Malta Marshall Islands Martinique Mauritania Mauritius Mayotte Mexico Micronesia, Federated States of Moldova Monaco Mongolia Montenegro Montserrat Morocco Mozambique Namibia Nauru Nepal Netherlands Netherlands Antilles New Caledonia New Zealand Nicaragua Niger Nigeria Niue North Korea Norway Oman Other Pakistan Palau Panama Papua New Guinea Paraguay Peru Philippines Poland Portugal Puerto Rico Qatar Romania Russian Federation Rwanda Saint Helena Saint Kitts Saint Lucia Saint Pierre and Miquelon Saint Vincent and the Grenadines Samoa San Marino Saudi Arabia Senegal Serbia, Republic Of Seychelles Sierra Leone Singapore Slovakia Slovenia Solomon Islands Somalia South Africa South Korea Spain Sri Lanka Sudan Suriname Svalbard Swaziland Sweden Switzerland Syria Taiwan Tajikistan Tanzania Thailand Togo Tonga Trinidad and Tobago Tunisia Turkey Turkmenistan Turks and Caicos Islands Tuvalu Uganda Ukraine United Arab Emirates Uruguay Uzbekistan Vanuatu Vatican City State Venezuela Vietnam Virgin Islands (U.S.) Wallis and Futuna Western Sahara Yemen Zambia Zimbabwe   We accept credit card payment transactions via the online checkout system! The checkout process is designed so that it communicates with the merchant to confirm that payment has been made and cleared. Other methods of payment are outlined through the online checkout process. Winning bidders must contact us within 3 days after auction close if special payment arrangements are needed. Your payment is expected within 5 days after the auction close. Unpaid auctions will be forfeited after 5 days of the auction close and the Item(s) will be relisted for sale. Items will be shipped within 24 hours (1 Business Day) upon receipt of payment from the winning bidder. (Certain orders may take longer for processing due to comprehensive final service inspections) A Shipment Tracking number(s) will be provided to inform Buyers of their expected ETA (Estimated Time of Arrival). Tracking number(s) will be provided the same day as order shipment. Thank you ALL MAJOR CREDIT CARDS & PayPal ACCEPTED               Powers Your Online Marketplace Make inventory management a breeze with Kyozou eBay Inventory Management Software
Condition:
Seller refurbished: An item that has been restored to working order by the eBay seller or a third party not approved by the manufacturer. This means the item has been inspected, cleaned, and repaired to full working order and is in excellent condition. This item may or may not be in original packaging. See the seller’s listing for full details. ...
Manufacturer Fluke
Analyzer Type Network Analyzers
Model OPV-WAN
Unit Type Complete Systems & Mainframes

Directions

Similar products from Network Analysis Complete Systems & Mainframes
People who viewed this item also vieved
By clicking "Accept All Cookies", you agree to the storing of cookies on your device to enhance site navigation, analyze site usage, and assist in our marketing efforts.

Accept All Cookies